On Monday 2nd of June, Obama announced his latest climate policy. The proposed directive aims to cut carbon-dioxide emissions from US power plants by 30 percent below 2005 levels by 2030 [1]. It is his most sweeping policy to address global warming so far.
A reduction of 30 percent seems to be in the same order of magnitude as Europe’s EU2020 and EU2030 targets. But is it really? Let’s take a closer look.
We will start by summarizing what Europe’s EU2020 and EU2030 climate packages consist of. The EU2020 package aims to cut total greenhouse gas (GHG) emissions of all participating countries by 20% below 1990 levels by 2020 [2]. In similar vein, the EU2030 package aims to cut total greenhouse gas (GHG) emissions of all participating countries by 40% below 1990 levels by 2030 [3].
These climate policies are defined by a number of criteria. First, the type of emission is specified. Second, the polluter to whom the target applies is defined. Third, a reference period is chosen to use as an emission benchmark. This is often done by specifying the emission during a certain year. Fourth, the actual reduction target is set. Fifth and finally, a target date is specified by when these emission reductions should be made.
With these criteria in mind, we can analyze the differences in Obama’s and Europe’s climate policies:
First, Obama’s policy only takes CO2 into account, while Europe’s are about all the greenhouse gases. It is true that, of all the greenhouse gases in the atmosphere, CO2 is accountable for the biggest share, but it is not the only one. CO2 represents approximately 84% of all greenhouse gases in the US1. [4]
Second, the new policy of Obama is only imposed on US power plants. The other climate policies are imposed on all industries. US power plants are roughly accountable for 38% of all of America’s CO2 emissions as shown in figure 1 [5]. Therefore, Europe’s policy covers a lot more emissions.
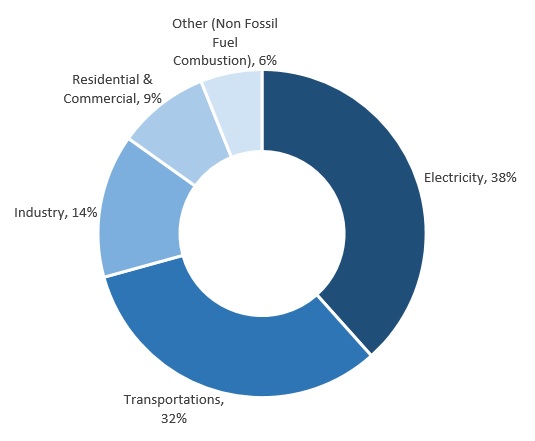
Figure 1: CO2 emission per industry in the US [5]
Third, the reference year of Obama’s policy is set at 2005 while Europe uses 1990 as a reference year for both policies. Since the amount of emitted CO2 grew between 1990 and 2005, a relative reduction referenced to 2005 will lead to a higher absolute emission than would be the case when referencing the same relative reduction to 1990. This is illustrated in the figure 2.
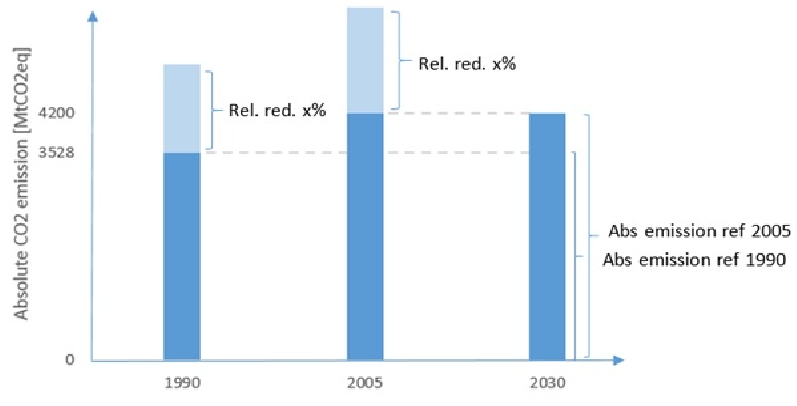
Figure 2: Resulting absolute emissions for equal relative reductions referenced to 1990 and 2005
Figure 2 shows that a same relative reduction will lead to a bigger absolute emission in 2030 when this relative reduction is referenced to 2005 instead of 1990.
An overview of the different criteria for each policy is given in the table below:
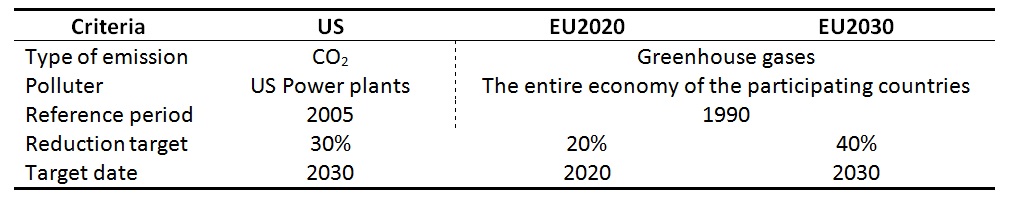
To compare Obama’s policy with Europe’s packages, we have to align the criteria by which they are evaluated. We choose to use the European criteria as the benchmark as these were first to be imposed.
Three different steps will be taken to compare the different policies. First, a CO2 reduction from power plants referenced to 2005 will be translated in a CO2 reduction from power plants referenced to 1990. US power plants emitted 2405,24 MtCO2eq in 2005 [6]. A reduction of 30% compared to this level means an absolute maximum emission of 1683,67 MtCO2eq per year. Since CO2 emissions from power plants amounted to 1824,87 MtCO2eq in 1990 [6], this means an absolute emissions reduction of 141,19 MtCO2eq is imposed by 1990 levels. This is equal to a relative CO2 reduction of 7,74% by 1990 levels.
Second, this amount of CO2 reduction from power plants is now converted to a CO2 reduction from all industries. US’ CO2 emissions from power plants account only for 38% of total CO2 emissions [5]. This means that a CO2 reduction of 7,74% from power plants has an equal absolute impact as a CO2 reduction of 2,94% from all industries2.
In a final step, this CO2 reduction from all industries is translated to an equal reduction of greenhouse gas emissions (GHG). CO2 emissions currently account for approximately 84% of all greenhouse gas emissions in the US [4]. A total CO2 reduction of 2,94% has therefore the same absolute impact as a total greenhouse gas reduction of 2,47%3.
In conclusion, Obama’s policy aims to reduce total GHG emissions from the US to an amount of 2,47% below 1990 levels. This is a significant lower reduction target than proposed by the EU2020 or EU2030 policy, which aims to reduce total GHG emissions of its participating countries by respectively 20% or 40% below 1990 levels. This said, we should note that it is a progressive climate policy in US’ history and a big step towards a more sustainable economy.
1 Greenhouse gas emissions are here denoted by their global warming potential. Each greenhouse gas has a different effect on global warming per ton emitted gas. To compare the effect on global warming of the different gases, they are expressed by their global warming potential in CO2 equivalents (CO2eq). This means that 500 kg of a gas which has a global warming effect double as big as the effect of 500 kg CO2, will be denoted as an emission of 1 ton CO2eq.
2 This calculation implies that the relative amount of CO2 from power plants compared to total CO2 emission will be the same in 2030 as now. This will not be the case, since the policy itself aims to reduce the emission from power plants. Since only emissions from power plants are cut, it is fair to assume that the amount of CO2 from power plants compared to total CO2 emissions will be lower in 2030 as is now. Therefore, the relative reduction of 2,94% is an overestimation of the expected CO2 emission reduction.
3 This calculation implies that CO2 emissions account for the same relative amount of greenhouse gases in 2030 as they do now. Since CO2 emissions are the bulk of greenhouse gases in the atmosphere, it is safe to assume that this percentage will be approximately the same in 2030.